Building Hopes
Data Art, Augmented Reality Experience, and Public Data for Google News Initiative
Our latest collaboration with Google Initiative is an experimental AR app to explore our hopes as individuals and as a society, to access Google trends data in a completely new way, and to allow us to reflect critically on our own interpretation of data.
We live in a world awash with information. Every time we walk the street holding our phones, every time we perform an online research or buy a product with our credit card data is created and often communicated to us. How can we make people care about a specific dataset? How can we form our own opinions and points of view on what matters to us? With Building Hopes, we want people to take a stand about what they are hopeful for - even in a historical moment that many define as hopeless and bleak - and have them look at Google search data through this framework of their own creation.
Download and play with it from the App Store, or check out the web version here
At Accurat, we imagined and designed an immersive data-art experience that invites people to formalize their hopes as permanent augmented reality sculptures and use them as a lens to explore and understand Google Trends data. In collaboration with our friends at MONOGRID, Accurat created a fully responsive web application and two native AR iOS and Android apps, built in Unity 3D using Apple’s ARKit and Google’s ARCore technologies.
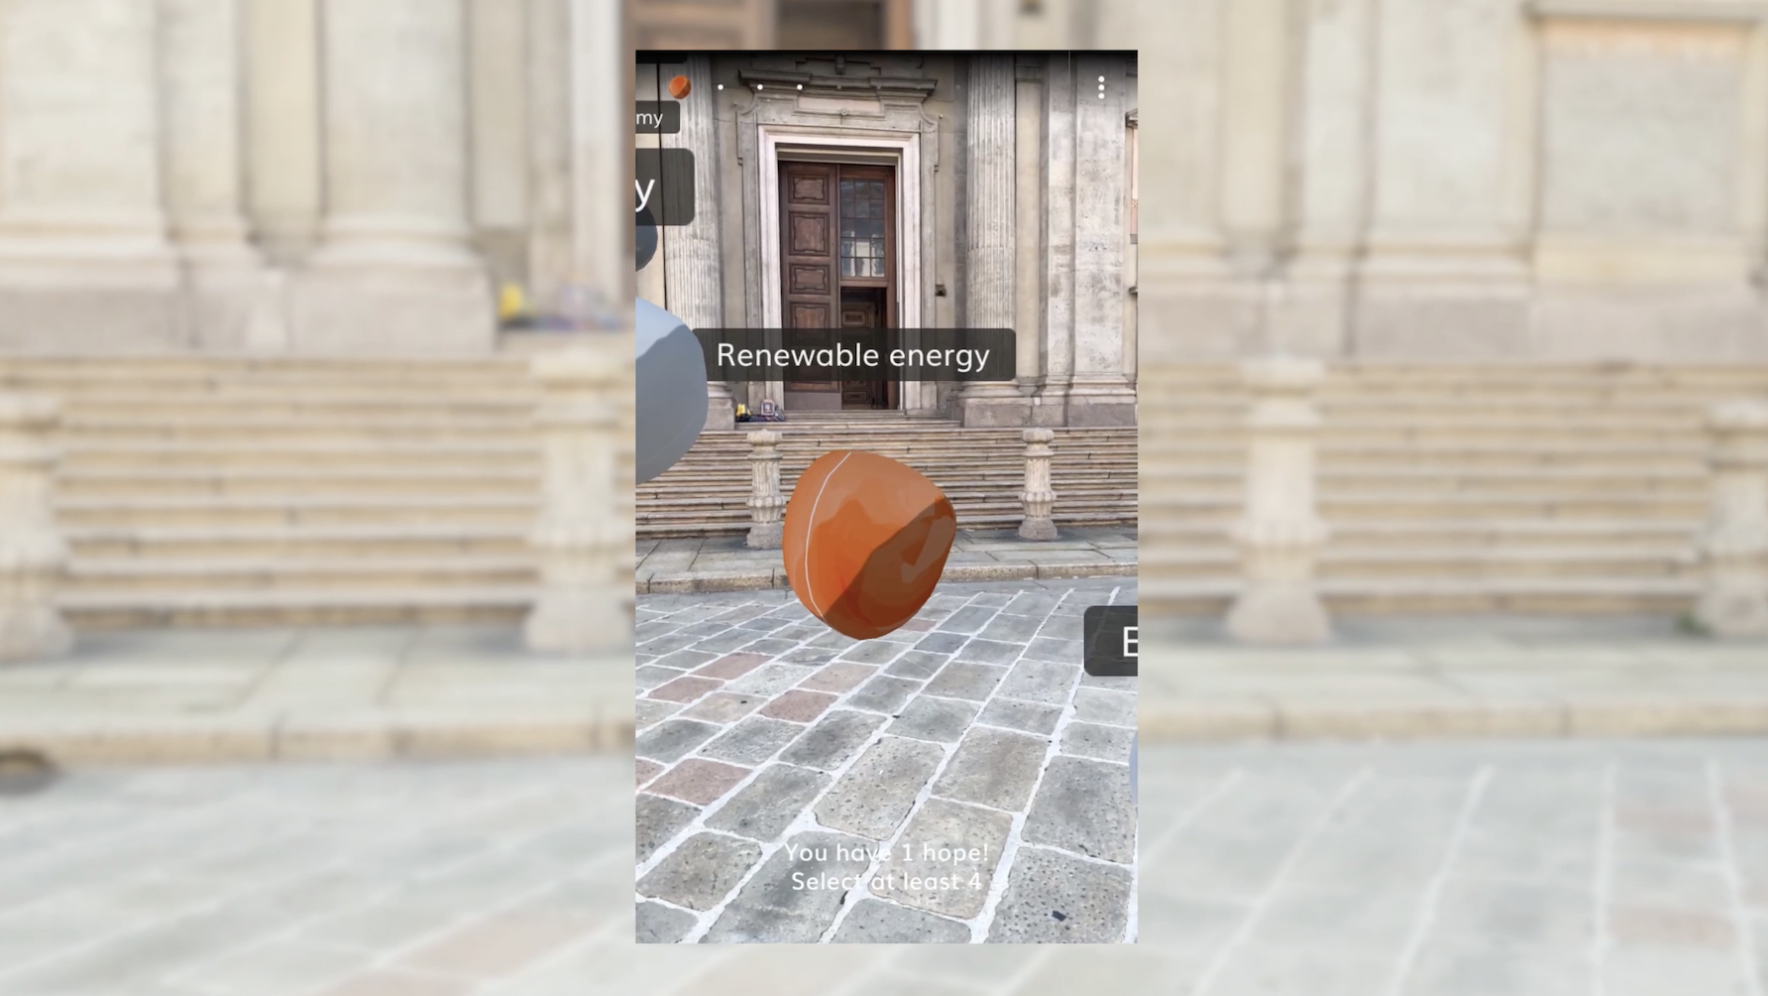
iOS/Android app: Hope sculpture placement
In the context of recent international tensions and of a grave concerns on the rise around the globe, it is also possible to recognize a growing energy, particular forms of personal and collective type of activism ,creating many little sparks of hope for the future that are spreading at the speed of social media. Building Hopes lets people create physical structures in the world: data sculptures made of balancing rocks that represent the ideas, concepts, movements they are hopeful for.
iOS/Android app: entity selection
Through the native app, which can also be accessed via the web, users are invited to choose up to ten ideas as they access the application; these ideas are then “weighted” and turned into rocks big and small, according to how much hope is assigned to them.
iOS/Android apps: Hope sculptures in different locations
Each rock represents a topic. They can be stacked to create a physical manifestation of people’s hopes and placed in a specific location around the world via Augmented Reality: Hope Sculptures for everyone else to discover and explore through the mobile app.
Once a sculpture is created, it can be used as a way to access Google Trends data on various topics, revealing how people around the world are searching for the same concepts, or discovering what others are hopeful for, and how ardently. The size and rotation of the rocks, their direction and speed are used to represent Google Trends’ data, creating a physical visualization of something ephemeral but integral to people’s personal beliefs.
iOS/Android app: Data exploration - Overview
Through the app, users can explore and discover other Hope Sculptures around the world both in the native augmented reality mobile app or in the more traditional web app that uses 3D graphics to visualize the sculptures: the three dimensions are used specifically to investigate how a more realistic space can foster new types of data exploration, and information.
iOS/Android app: Data exploration - Close up
The AR feature of the product brings an element of “physicality” to something as intangible as our hopes, letting people actually erect their sculpture in the world and interact more naturally with it.
Experimenting with a three-dimensional environment and the Augmented Reality space has led us to develop unusual ways to represent and interact with data.
The AR feature of the product brings an element of “physicality” to something as intangible as our hopes, letting people actually erect their sculpture in the world and interact more naturally with it.
Also, as a natural way of interacting with the trend, temporal data over a timeline are explored by means of physically turning your screen around, accessing Google Trends in a real, 360 degree, space. Features such as the speed and direction of the rotating rocks are used as unusual but clear ways to represent trends in the data.
With Building Hopes, we are experimenting with how data visualization can look and behave in augmented reality, and we are also implicitly letting people create their own frame of reference before letting them look at data: trends will inevitably have a different meaning for everyone, and, by having people make a conscious decision on the reasons why a topic is important to them and by providing a fully explorable 3D environment, we hope to create a more meaningful and personal experience of interaction with data while encouraging people to think critically about their own interpretation of it.


