Philosophy
Data is the most powerful force in society today. Data is everywhere—present in every moment, every event, every transaction or interaction with someone else. Every time you send a text, call a friend, fill out a form, hail a taxi, stream a movie, surf the web, pay a bill, buy groceries, buy anything, take your temperature, count your steps, swipe right (or left), you generate data. There’s data in the weather, in the air, in the ground, in outer space. If you own a smartwatch, you carry data on your body. If you have a cardiac pacemaker, you carry data in your body.
We are surrounded by an invisible ecosystem of data, and it’s becoming harder and harder to ignore.
From the rise of artificial intelligence to the specter of global climate change, today data makes and shapes our lives. But what is data, really? It’s a question that is surprisingly hard to answer. To some, data means numbers: figures on a screen, dots on a graph. It’s also often (falsely) equated with facts, an invariable form of concrete knowledge that always tells the truth. But in reality, data is hardly so incontrovertible. Data is an abstraction of reality, a useful but imperfect representation of real life.
Like life, it’s full of nuance, imprecision, and ambivalence. It’s quantitative and it’s qualitative. And it’s made by us—humans. No surprise, then, that data is often riddled with human bias.
My obsession with data began in childhood, counting and sorting the contents of my grandmother’s tailor shop in Italy. Data helped bring logic to chaos, even if the nebulous taxonomies I used to organize the shop’s buttons and ribbons were only in my head. In college, I discovered architecture, an entire profession rooted in numbers, and became infatuated with urban mapping: how one could visualize, through data, the spatial and social footprint of a city. The more sophisticated your map became—the more data it took into account—the more true to life it was.
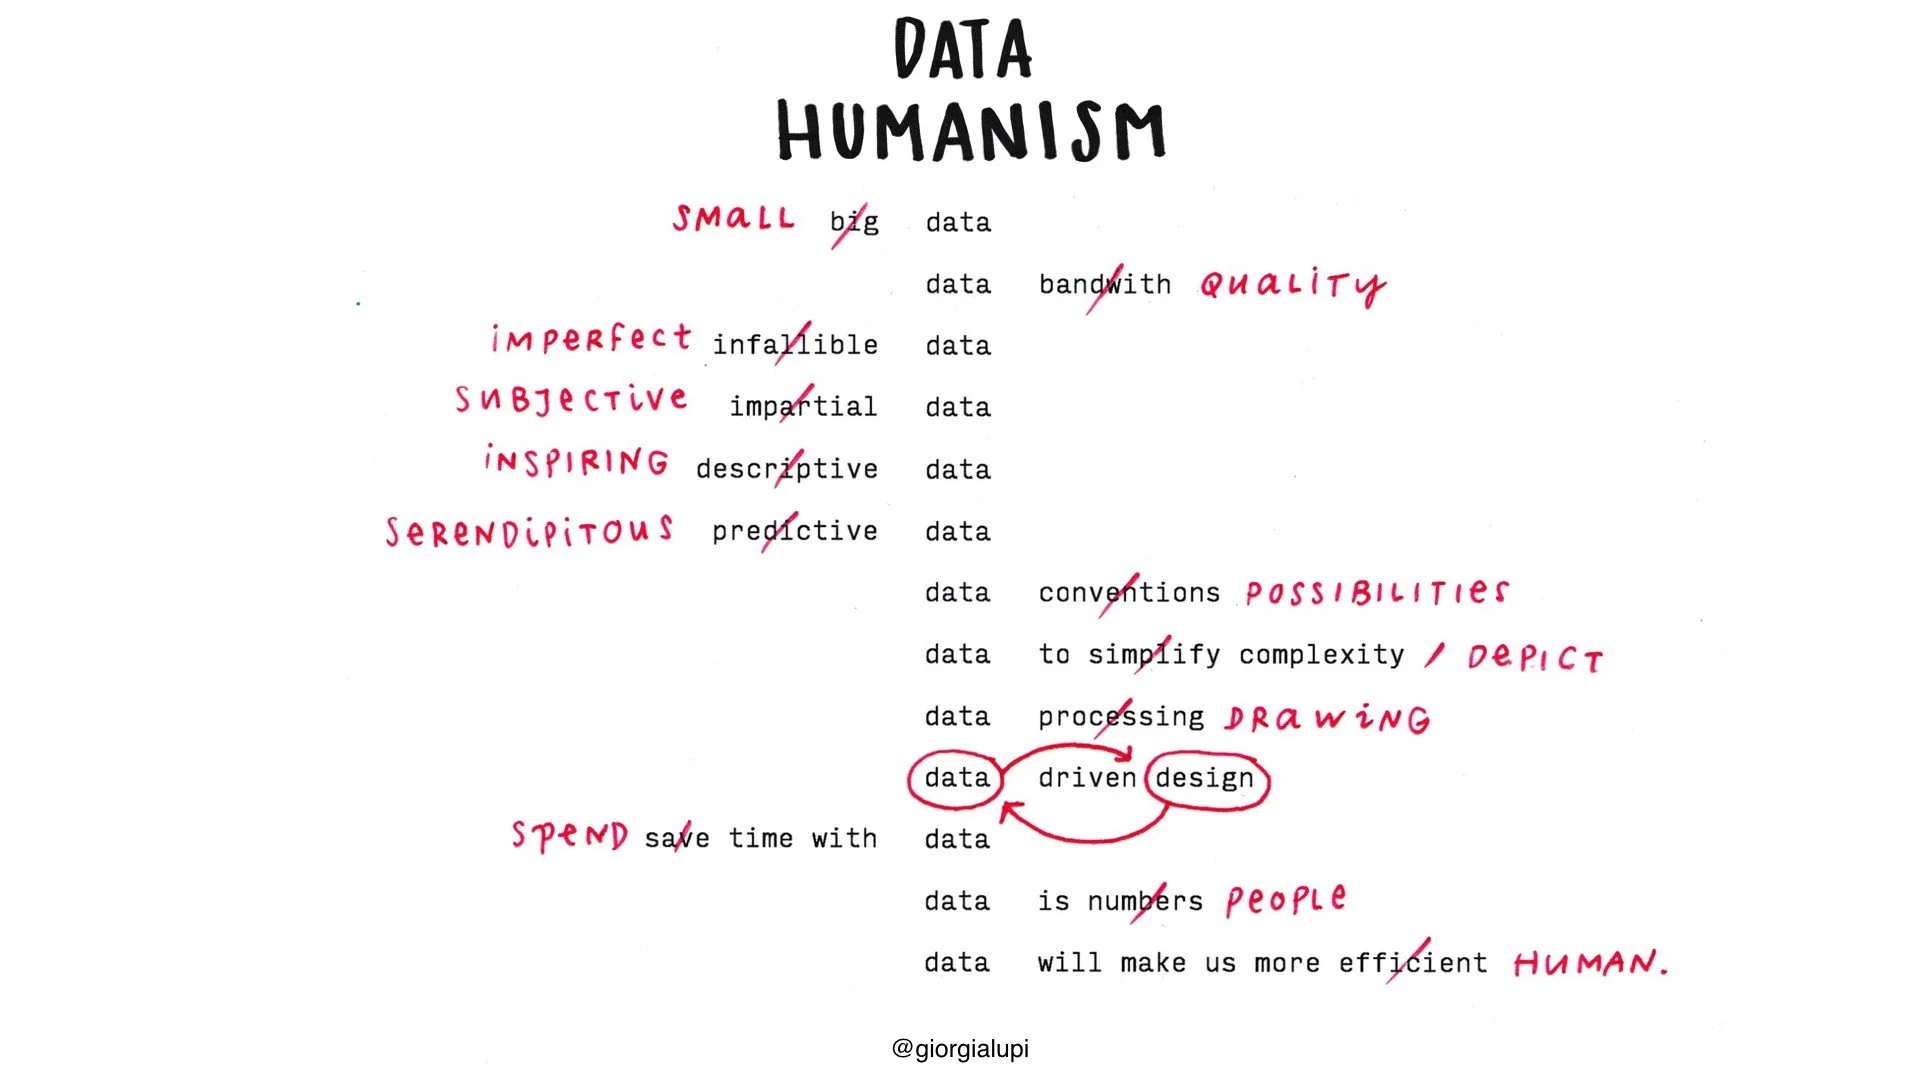
Today, my team at Pentagram helps companies and individuals communicate data to the wider world. While most designers use color, shape, or typography to express ideas, we use data. Sometimes this looks like a traditional graph or a chart, but more often it takes unconventional forms: a sculpture, a website, a mural, even an article of clothing. Really, anyone can use data as a lens through which to understand the world. You just need to know how. Akin to a pair of glasses that can be taken on and off, data is a filter to find pattern, structure, and ultimately meaning, one subject at a time. I call this superpower Data Humanism, and it’s a radically different way to think about, understand, and engage with numbers. As the name suggests, Data Humanism centers people, rather than numbers, in its conception of data. Just as the humanist movement during the Renaissance sought to emphasize individuals rather than God as the ultimate source of meaning, Data Humanism underscores the foundational role of people—us—in data’s collection, analysis, and communication.
Despite how it may sometimes appear, data is always the product of human hands.
In our hyper-complex, ever-changing world, I don’t believe there’s just one definition of data. There can’t be. Data’s pervasiveness means that there are multiple definitions—multiple meanings—that must be contended with if we are to truly understand the full potential of data in our lives.
As data becomes further entrenched in society, all of us will need to think more critically about the data we produce, consume, interpret, and manipulate daily.
— Giorgia Lupi, 2025
Watch my TED Talks to Learn More
How we can find ourselves in data
TEDNYC, March 2017
What long COVID taught me about life (and data)
TED@BCG, September 2024